If you’ve ever looked at statistics in school, business reports, sports, or news articles, you’ve probably come across the terms mean and median. Although they both measure the center of a set of numbers, they are not the same. Understanding the difference between mean vs median helps you interpret data more accurately and avoid common mistakes.
Whether you’re a student, teacher, researcher, or simply curious about statistics, this guide explains everything you need to know. We’ll cover definitions, examples, key differences, common errors, and answer frequently asked questions in simple language.
Quick Answer
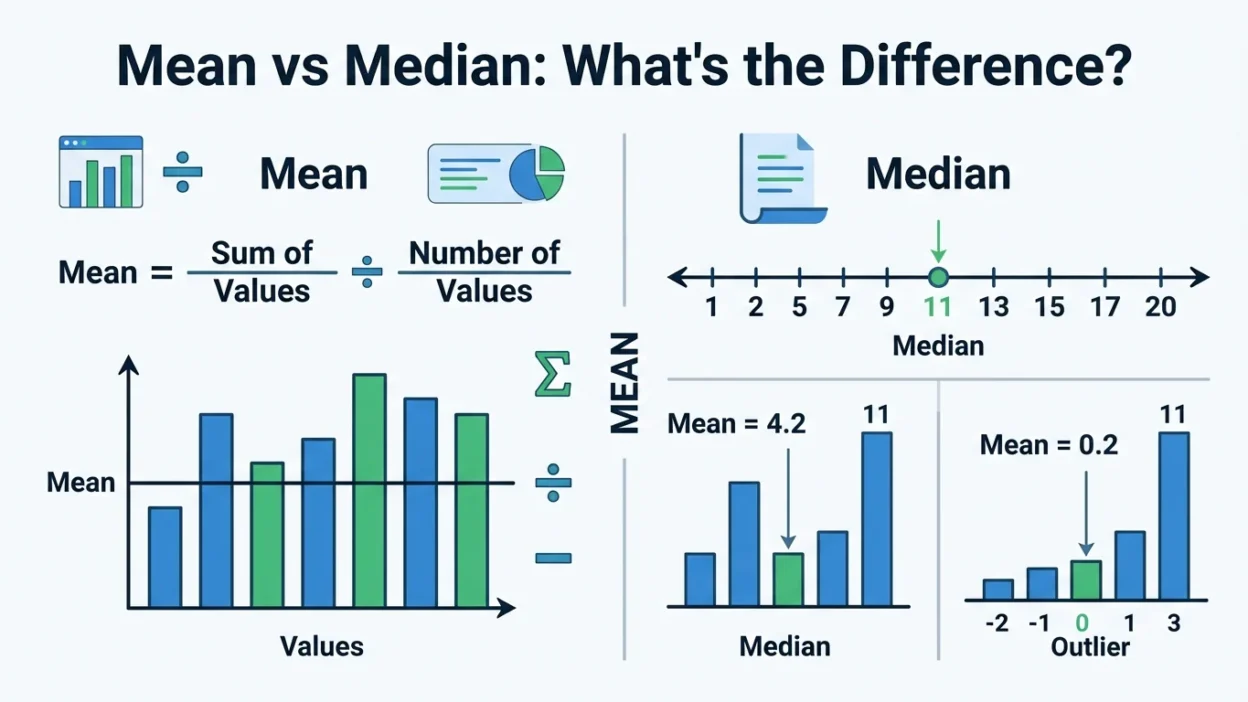
The mean is the average of all numbers in a dataset. You calculate it by adding all the values together and dividing by the number of values.
The median is the middle value when the numbers are arranged in order. If there are two middle values, you average those two numbers.
- Use the mean when data is evenly distributed without extreme values.
- Use the median when the dataset contains outliers or is skewed.
What Is Mean?
The mean is the arithmetic average of a group of numbers. It is one of the most commonly used measures of central tendency.
Formula
Mean = Sum of all values ÷ Number of values
Example
Suppose five students scored:
70, 75, 80, 85, 90
Step 1: Add the scores.
70 + 75 + 80 + 85 + 90 = 400
Step 2: Divide by the total number of scores.
400 ÷ 5 = 80
The mean is 80.
The mean considers every value in the dataset, making it useful when all values are equally important.
What Is Median?
The median is the middle number in a dataset after arranging the numbers from smallest to largest.
Unlike the mean, the median depends only on the position of values rather than their total.
Example with Odd Numbers
Dataset:
15, 20, 25, 30, 35
The middle value is 25.
So, the median = 25.
Example with Even Numbers
Dataset:
10, 20, 30, 40
The middle values are 20 and 30.
Median = (20 + 30) ÷ 2 = 25
The median works especially well when a dataset contains unusually high or low values.
Mean vs Median: Key Differences
| Feature | Mean | Median |
|---|---|---|
| Definition | Average of all values | Middle value in ordered data |
| Calculation | Add values and divide | Arrange values and find the middle |
| Affected by Outliers | Yes | No, or very little |
| Best Used For | Symmetrical data | Skewed data |
| Represents Every Value | Yes | No |
| Easy to Calculate | Yes | Yes |
Mean vs Median Example with Outliers
Let’s compare the two using real numbers.
Dataset A:
20, 22, 24, 26, 28
Mean:
(20 + 22 + 24 + 26 + 28) ÷ 5 = 24
Median:
Middle number = 24
Both values are the same because the data is evenly spread.
Now consider Dataset B:
20, 22, 24, 26, 100
Mean:
(20 + 22 + 24 + 26 + 100) ÷ 5 = 38.4
Median:
Middle number = 24
Notice how one very large value increased the mean significantly, while the median stayed the same. This is why the median is preferred when data contains outliers.
When Should You Use the Mean?
The mean is most useful when:
- Data is evenly distributed.
- There are no extreme values.
- Every observation should contribute equally.
- Comparing overall averages.
- Performing many statistical analyses.
Common Examples
- Average exam scores
- Average daily temperature
- Average monthly sales
- Average rainfall
- Average production output
When Should You Use the Median?
The median is a better choice when:
- The data contains outliers.
- Income or salary data is being analyzed.
- House prices vary greatly.
- Data is skewed.
- You want the “typical” value rather than the mathematical average.
Common Examples
- Household income
- Property prices
- Age distributions
- Waiting times
- Medical expenses
Why Mean and Median Can Be Different
The mean includes every number in the calculation.
The median only depends on the middle position.
When one or more values are extremely large or small, they pull the mean upward or downward. The median remains relatively stable.
For example:
Monthly incomes:
$2,000, $2,100, $2,200, $2,300, $50,000
Mean:
$11,720
Median:
$2,200
Here, the median gives a much better picture of a typical person’s income.
Common Mistakes People Make
Many learners confuse mean and median because both describe the center of data.
Here are some common mistakes:
- Using the mean even when extreme values exist.
- Forgetting to arrange numbers before finding the median.
- Dividing by the wrong number when calculating the mean.
- Thinking mean and median are always equal.
- Ignoring outliers that affect averages.
- Assuming the median uses every value equally.
Checking your dataset before choosing a measure helps avoid these errors.
Real-Life Uses of Mean and Median
Understanding mean vs median becomes easier when you see how they are used in everyday life.
Education
Teachers often calculate the mean score of an exam.
If one student receives an unusually low or high score, the median may better represent the class performance.
Business
Companies use the mean to analyze average sales.
They often use the median to understand typical customer spending.
Healthcare
Researchers calculate average treatment outcomes using the mean.
Median survival time is commonly reported because medical data is often skewed.
Real Estate
Median home prices are usually more informative than average prices because luxury homes can dramatically increase the mean.
Economics
Governments often report median household income to better reflect what a typical family earns.
Is Mean Better Than Median?
Neither is better in every situation.
The right choice depends on your data.
Choose the mean if:
- Data is balanced.
- There are no unusual values.
- You need the mathematical average.
Choose the median if:
- Data is skewed.
- Outliers exist.
- You want a more representative center.
Statisticians often calculate both before deciding which best describes the data.
American vs British English Differences
There is no spelling or meaning difference between mean and median in American and British English.
Both varieties use these statistical terms in exactly the same way.
The formulas, definitions, pronunciation, and applications remain consistent across English-speaking countries.
Tips to Remember the Difference
A simple way to remember:
- Mean = Mathematical average
- Median = Middle number
Another helpful trick:
- If the data looks balanced, think mean.
- If the data has unusual values, think median.
These simple reminders can help you choose the correct measure quickly.
FAQs
What is the main difference between mean and median?
The mean is the average of all values, while the median is the middle value after arranging the data in order.
Which is more accurate, mean or median?
Neither is always more accurate. The best choice depends on the type of data and whether outliers are present.
Why is the median less affected by outliers?
Because the median depends on the position of values rather than their actual size, extremely large or small numbers have little effect.
Can mean and median be the same?
Yes. In symmetrical datasets without extreme values, the mean and median are often identical or very close.
Is median always one of the numbers in the dataset?
Not always. If there is an even number of observations, the median is the average of the two middle values.
Which is used for salary statistics?
Median is generally preferred because a few very high salaries can make the mean misleading.
How do you calculate the mean?
Add all the numbers together and divide by the total number of values.
Why do researchers report both mean and median?
Reporting both provides a more complete understanding of the data and helps identify skewed distributions or outliers.
Summary
Understanding mean vs median is essential for interpreting data correctly. The mean calculates the average by using every value in a dataset, while the median identifies the middle value after arranging the numbers in order. Although both measure the center of data, they often produce different results when outliers are present.
Choosing between the mean and median depends on the nature of your data. The mean works best for evenly distributed datasets, whereas the median provides a better representation when values are skewed or contain extreme observations. Knowing the difference allows you to make better decisions, analyze information accurately, and understand statistics with greater confidence.

William Harved is a passionate language enthusiast and digital writer specializing in English spelling, grammar clarity, and common writing mistakes. As the primary author of Spelword.com, he focuses on helping readers understand confusing word pairs, correct spelling errors, and improve everyday communication.